Short answer: Four follow-ups to Stephen Follows’s runtime analysis using the CPRF Movie Database. Longer films have better legs but only up to about 135 minutes. Franchise escalation is real but depends on creative-team continuity. Source material predicts runtime more than budget alone. Critics and audiences converge on long films rather than diverging.
Key findings
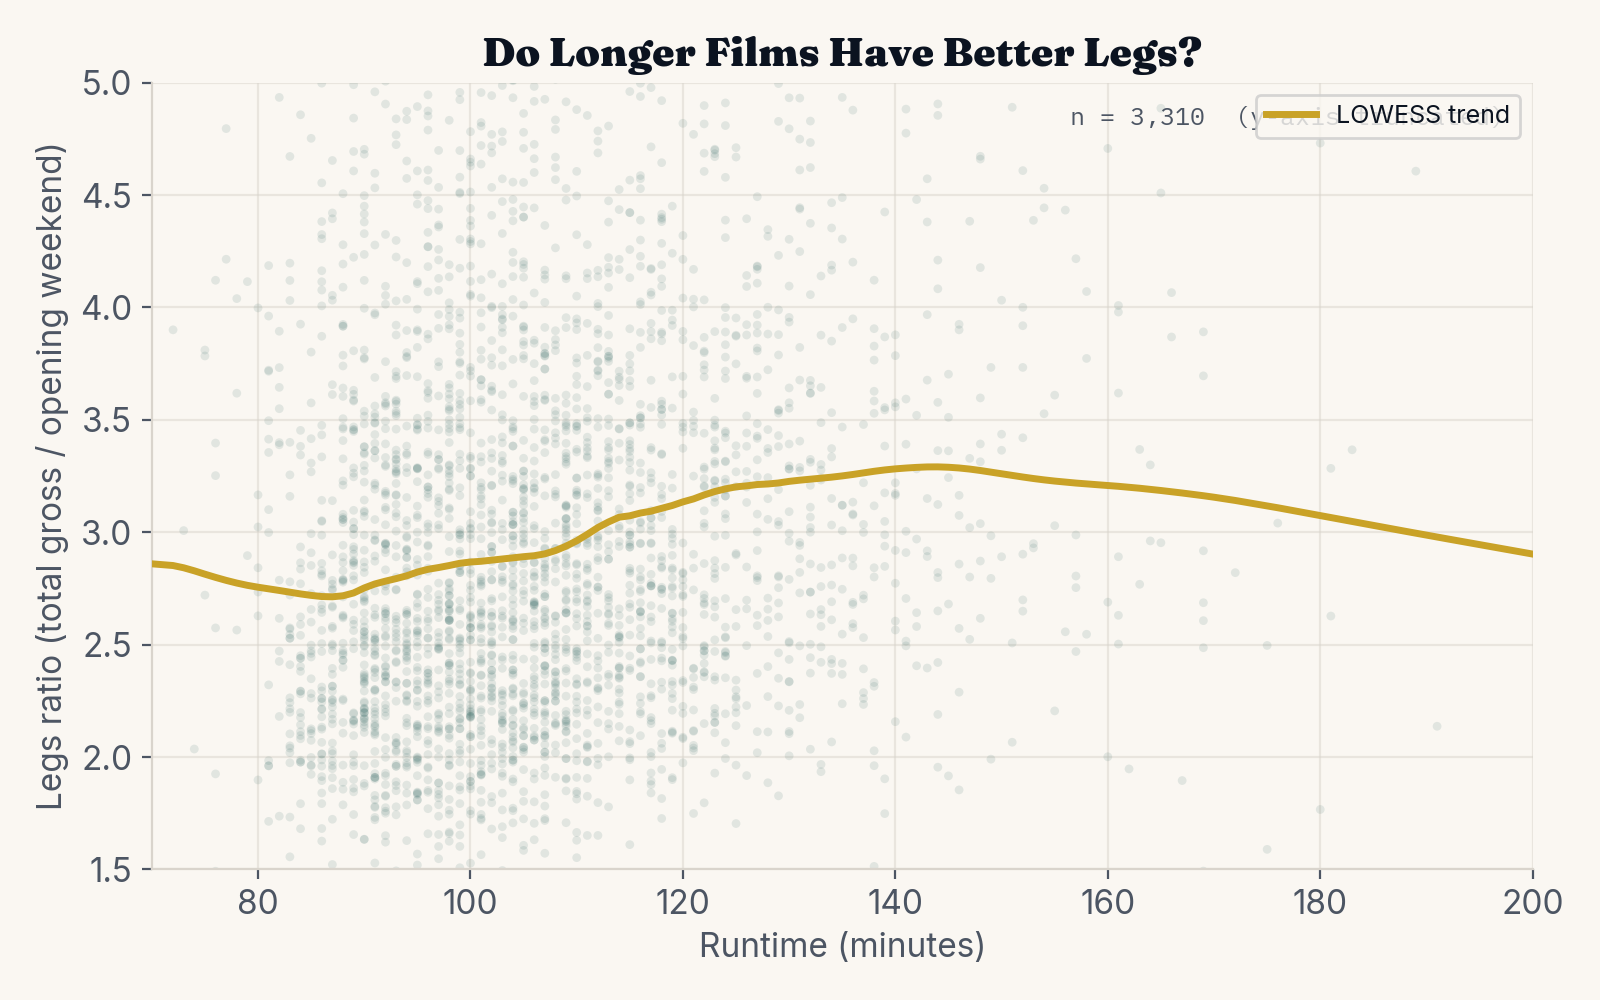
Legs plateau around 135 minutes. Across 3,310 wide releases earning $1M+, legs ratios climb modestly from ~2.8x at 90 minutes to ~3.3x near the 130-140-minute mark, then flatten and even dip slightly. The relationship is statistically significant (Spearman rho = 0.18, p < 0.001) but small. Pairwise tests confirm the gains concentrate between 90 and 135 minutes.
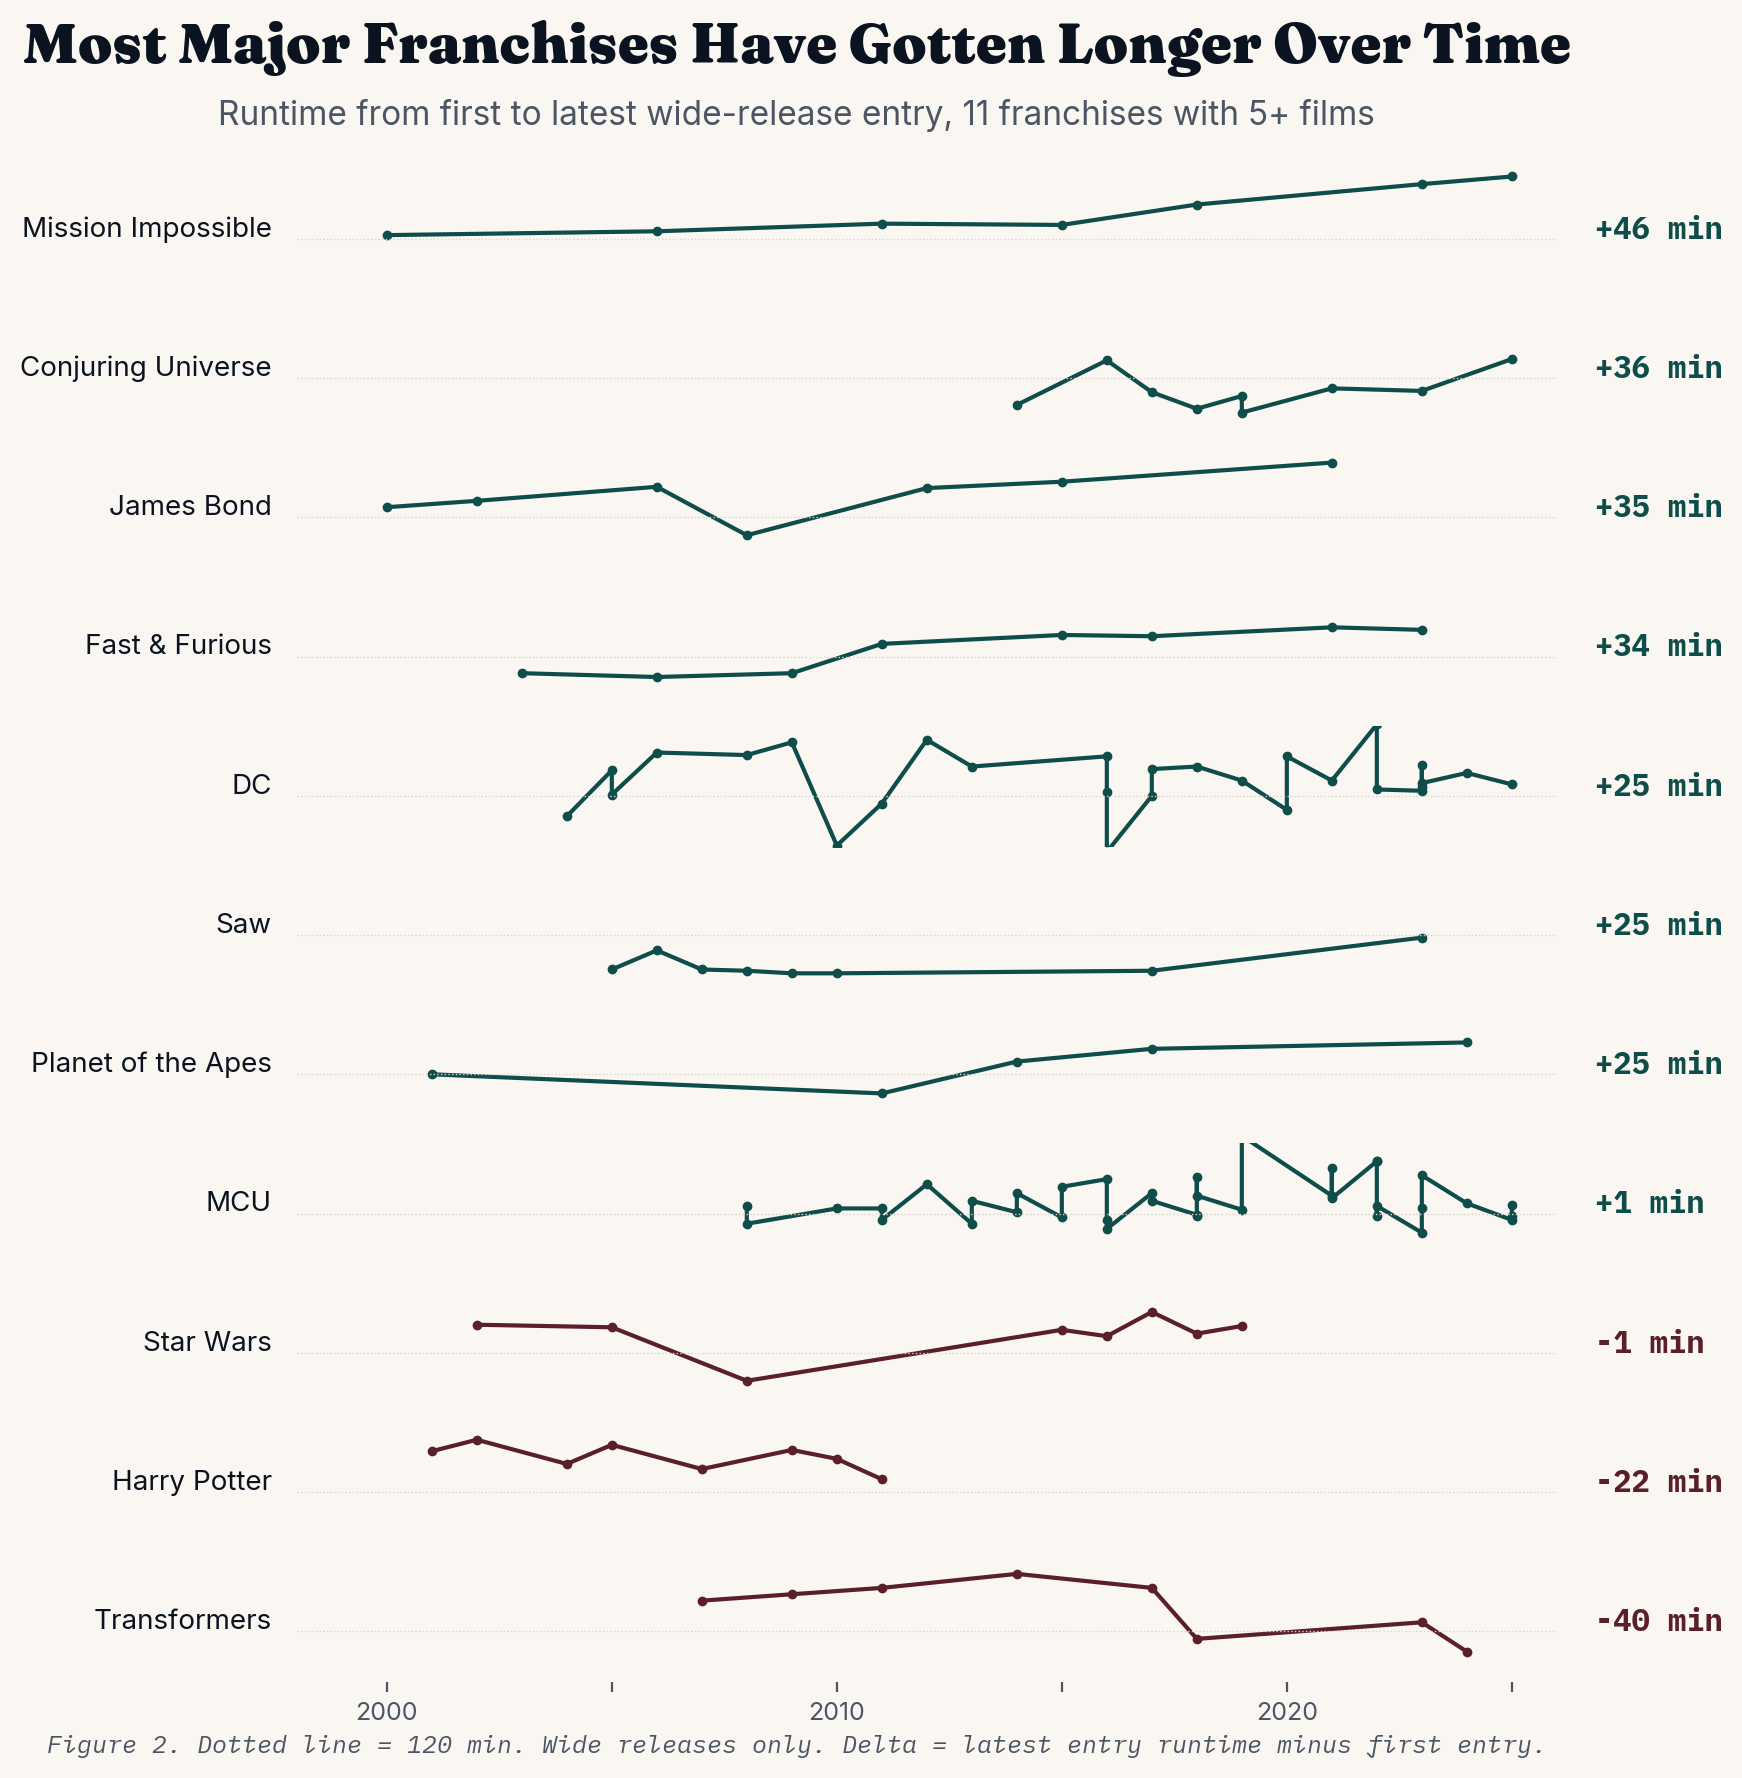
Franchise escalation is real but not universal. Mission: Impossible (+46), Conjuring Universe (+36), James Bond (+35), Fast & Furious (+34), and Saw (+25) all grow as Follows predicted. But Transformers shrank (-40) as the franchise pivoted to leaner installments, Harry Potter peaked mid-series, and the MCU shows essentially zero net change across 37 entries. When the creative team turns over, the runtime clock can reset.
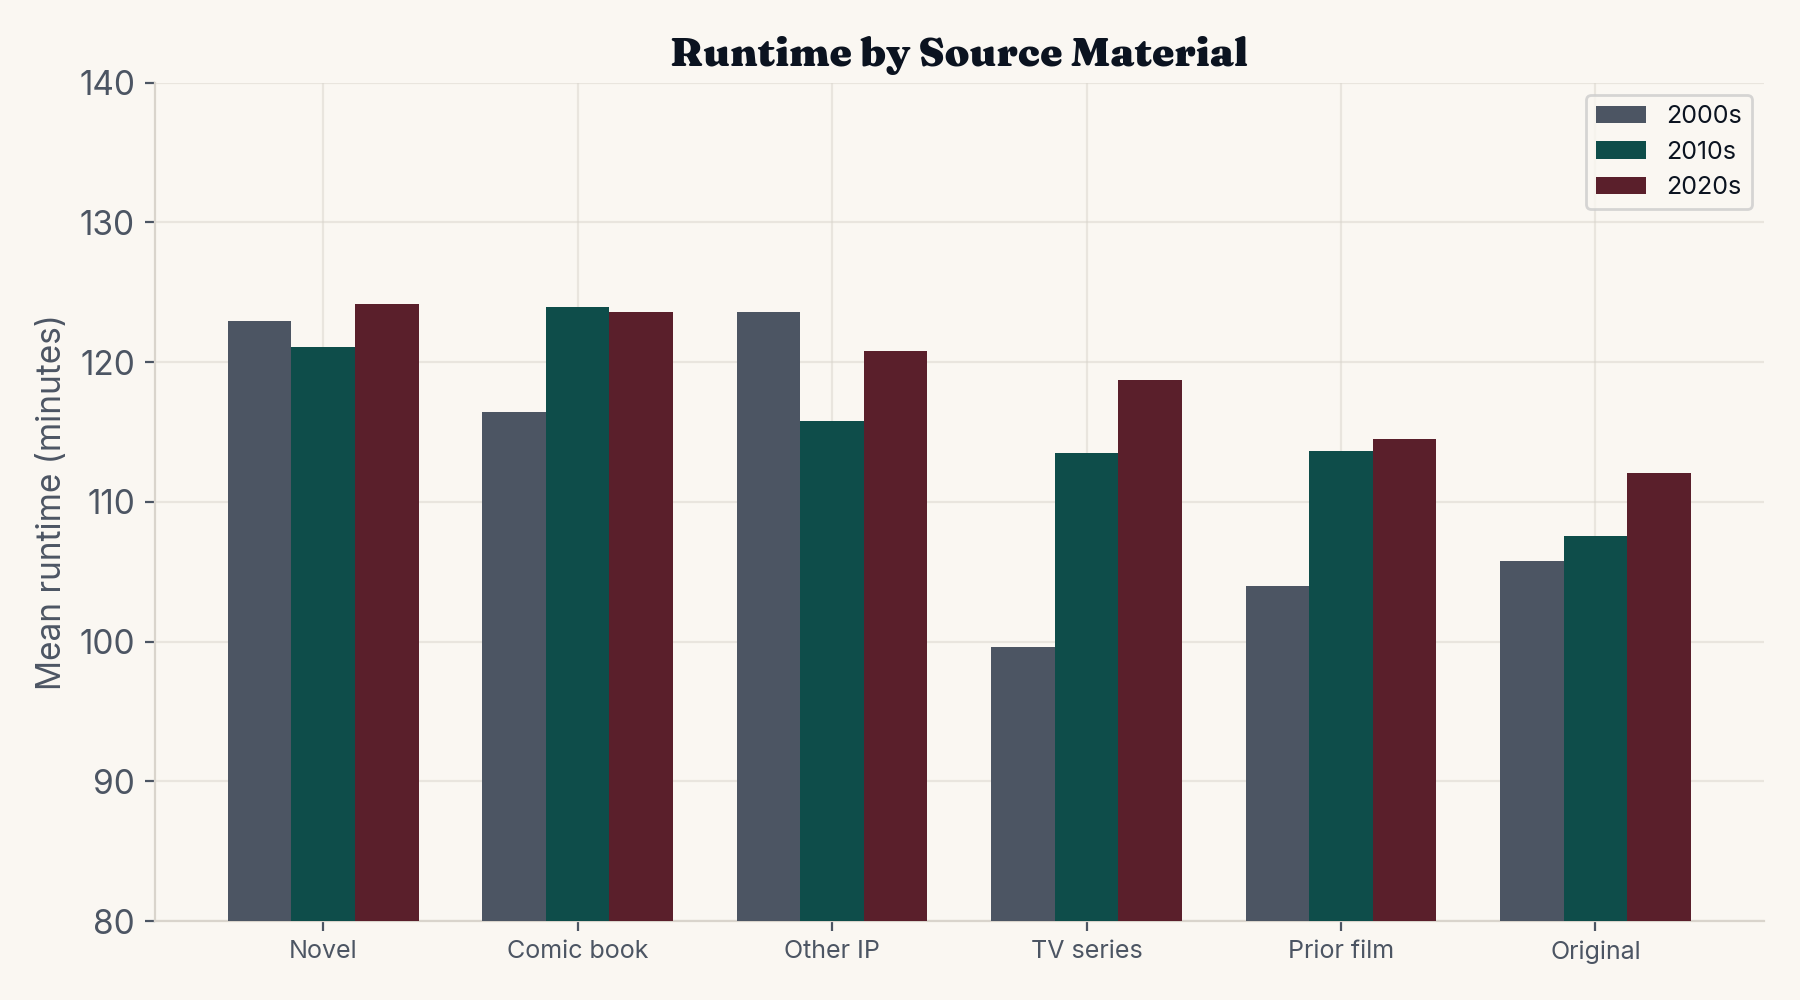
Source material is a strong predictor. Novel adaptations (121-124 min) and comic book films (116-124 min) are the longest releases in every decade. TV-series adaptations grew fastest (+19 min from the 2000s to the 2020s), while original screenplays remain the shortest (112 min today, +6 since the 2000s). Built-in fanbases create fidelity pressure that resists cuts.
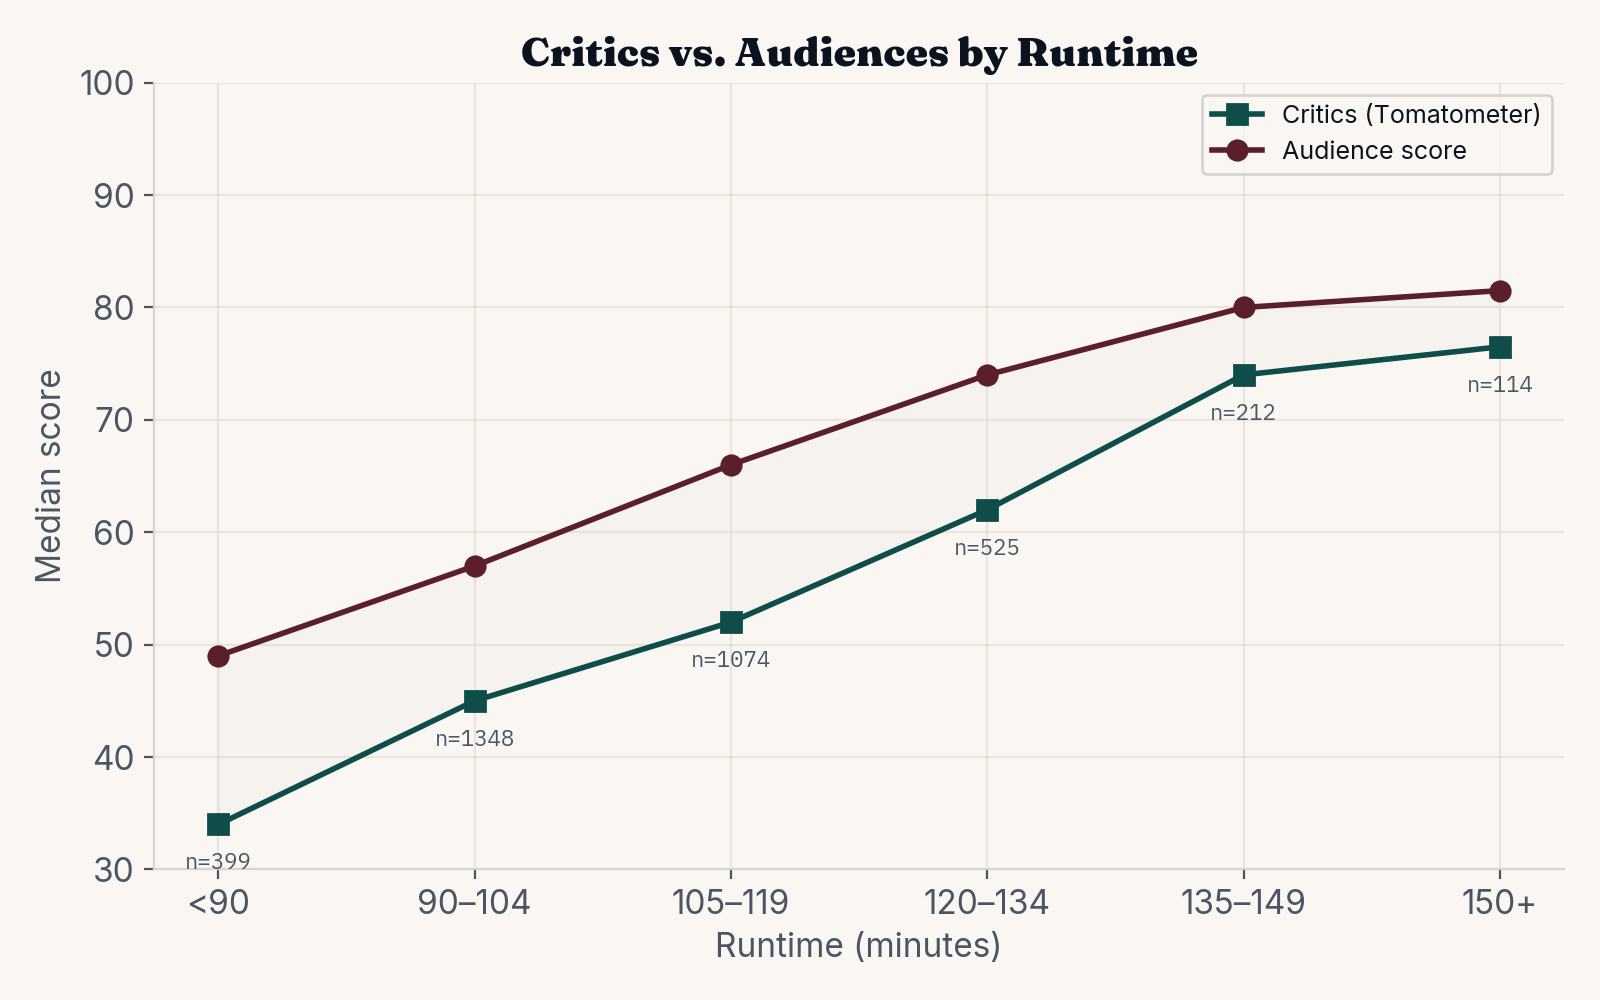
Critics and audiences converge on long films. Both Rotten Tomatoes critic and audience scores rise monotonically with runtime, but the gap narrows from 15 points (sub-90 min) to 5 points (>150 min). Median Tomatometer for sub-90-minute releases is 34%; for films over 150 minutes, it is 77%. The films where critics and audiences agree most are the long ones — the opposite of the “self-indulgent prestige bloat” story.
Data
CPRF Movie Database: ~5,000 wide-release films (500+ peak theaters, $1M+ gross) enriched with IMDb metadata, budget, MPAA rating, source material, Rotten Tomatoes critic and audience scores, and per-film theatrical run data. Replicates the broad strokes of Follows’s findings on a different underlying dataset, suggesting the patterns are robust across data-collection choices.
Publication
CPRF Substack explainer responding to Stephen Follows’s runtime analysis: “Four Footnotes on Film Runtime.”
See also
- How saturated is the box office with franchise films — same CPRF Movie Database, franchise classification underlies chart 2 here
- Does an Oscar nomination boost box office revenue — same Substack series, daily box office data
- How much is an Oscar win worth at the box office — same Substack series, prestige effects on revenue
- How big was the 2024 Oscar nomination bump — same Substack series, theater-expansion mechanics
- Who do my movie tastes overlap with — film selection and critical consensus
- The Most Expensive Party Balloon in History — shared data journalism approach
- Are essay-based tests a reliable metric of student performance on college-level writing tasks — shared inter-rater reliability framing (critics vs. audiences here, human raters vs. NLP models there)